


Phosphorus is a useful process indicator because it is largely associated with phospholipids (gums) in crude seed oils. Excess gums can impair bleaching and filtration, increase oil losses, and contribute to colour problems at high temperatures.
Thank you for reading this post, don't forget to subscribe!Monitoring Phosphorus Content in Edible Oils helps confirm whether degumming is working consistently.
Results are reported in mg/kg (ppm by mass). Targets depend on the oil and refining route; physical refining generally requires more effective degumming than chemical refining.
Track Phosphorus Content in Edible Oils by batch and stage; see our edible oil processing and quality-control guide.
Sources of phosphorus in crude and refined oils
The main source is phospholipids naturally present in oil-bearing seeds. Phosphorus Content in Edible Oils varies with feedstock and processing history. Key influences include:
- Naturally occurring phospholipids: common classes include phosphatidylcholine, phosphatidylethanolamine, phosphatidylinositol, and phosphatidic acid.
- Seed and extraction history: crop variety, seed condition, extraction method, and storage can change the incoming load.
- Calcium and magnesium: salts of some phospholipids are harder to remove by water degumming alone.
- Treatment chemicals: phosphoric acid introduces additional phosphorus; if it is not separated or adsorbed as intended, it can affect a later result.
- Suspended material and contamination: particles, unclean sampling equipment, or sample carryover can produce a result that does not represent the bulk oil.
Interpret the result with the oil’s history and sample point. A total-phosphorus result does not identify every phosphorus-containing compound or directly measure total gum mass.
AOCS notes that the relationship between phosphorus and total phospholipids varies, so any conversion factor should be validated for the oil and plant concerned (AOCS, Introduction to Degumming).
Typical phosphorus levels in different crude oils
Crude-oil values vary, so these are reported ranges, not purchasing limits. A degumming patent compiles ranges of 400–1,500 ppm for soybean oil, 300–700 ppm for sunflower oil, and 200–900 ppm for canola oil. Actual results may fall outside these ranges (US patent US9045712B2, Table 2).
| Crude oil | Reported phosphorus range | What it means for the refinery |
|---|---|---|
| Soybean oil (SBO) | 400–1,500 ppm | Often carries a substantial phospholipid load; analyse each feed batch. |
| Sunflower oil (SFO) | 300–700 ppm | Feed quality and the share of non-hydratable phospholipids can change the degumming response. |
| Canola/rapeseed oil | 200–900 ppm | A wide range is reported, so set the treatment based on the measured feed and validated process data. |
Here, ppm means mg/kg of elemental phosphorus. Trend: Phosphorus Content in Edible Oils by batch and oil source.
A phosphorus content result of 500 ppm is useful for mass balance, but it cannot determine the acid dose because the phospholipid profile and calcium or magnesium levels may differ.
Why phosphorus control matters during refining
Phospholipids can hold water and form emulsions, trapping neutral oil in the gums. Residues may also affect bleaching, filtration, colour, and physical-refining readiness.
Tracking Phosphorus Content in Edible Oils links lab results with yield and process stability. For related controls, see edible-oil bleaching and deodorization.
- Oil yield: poorly separated gums can carry valuable neutral oil into the heavy phase; high Phosphorus Content in Edible Oils can flag poor separation.
- Bleaching: residual gums may increase adsorbent demand and contribute to filter problems. Review Phosphorus Content in Edible Oils alongside filtration pressure.
- Colour and heat stability: residual phosphorus-bearing material can contribute to colour deterioration during later high-temperature treatment. For further reading, see our guide to colour reversion in edible oils.
- Physical refining: low phosphorus before bleaching is often an important process target because no caustic neutralization stage follows.
- Troubleshooting: a rise in Phosphorus Content in Edible Oils may flag poor dosing or separation.
Phosphorus Content in Edible Oils should be interpreted according to the process route:
- Chemical refining: some phospholipids may also leave with soapstock during neutralization.
- Physical refining: degumming must usually remove more of the phosphorus-bearing material before bleaching and deodorization.
- Reference targets: AOCS discusses below 10 mg/kg after degumming as general guidance and a 3 mg/kg pre-bleaching recommendation in a physical-refining context. These are technical references, not universal legal limits (AOCS, Oil Refining; AOCS, Enzymatic Degumming).
How 85% phosphoric acid helps remove phosphorus-bearing gums
Phosphoric acid is used in some degumming systems to condition non-hydratable phospholipids, especially those associated with calcium and magnesium.
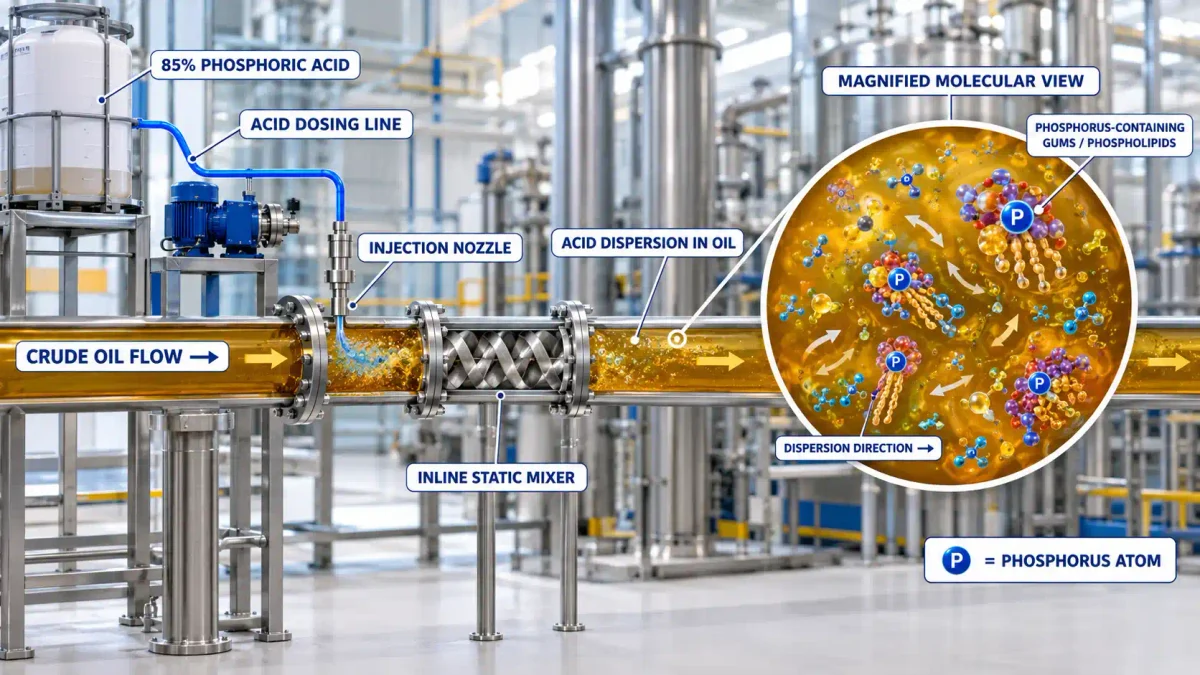
It helps convert them into forms that can be hydrated or separated; it does not destroy elemental phosphorus. Good performance depends on the whole treatment sequence:
- Prepare and deliver the approved acid concentration accurately.
- Provide suitable mixing and contact for the specific oil and process.
- Add water where required by the validated process.
- Separate the treated gums or precipitated material using the designed centrifuge or separation stage.
- Use the required adsorption or filtration stage to remove carryover.
- Confirm the outcome by testing the outlet oil rather than judging the dose alone.
The target is to lower Phosphorus Content in Edible Oils by moving phosphorus-bearing material out of the oil phase while avoiding unnecessary oil loss.
85% phosphoric acid means 85% H₃PO₄ by mass, not 85% elemental phosphorus. Using molecular masses of 97.994 for H₃PO₄ and 30.974 for phosphorus:
Elemental phosphorus fraction = 0.85 × (30.974 ÷ 97.994) = 0.2687, or approximately 26.87% by mass.
Each kilogram therefore contains about 0.2687 kg (268.7 g) of elemental phosphorus. Acid carryover may raise the next Phosphorus Content in Edible Oils result temporarily.
Worked example: 500 ppm phosphorus in crude oil
For 1,000 kg of oil at 500 mg/kg, the starting oil contains 500 g of elemental phosphorus. The table shows the phosphorus represented by sample acid doses and helps interpret post-treatment Phosphorus Content in Edible Oils.
The last column is theoretical accounting only, not an outlet prediction or dose recommendation.
| 85% phosphoric acid dose | Dose as % of oil mass | Elemental phosphorus added per tonne | Theoretical total if all added P remained in oil* |
|---|---|---|---|
| 0.5 kg/t | 0.05% | 134 g | 634 mg/kg |
| 1.0 kg/t | 0.10% | 269 g | 769 mg/kg |
| 2.0 kg/t | 0.20% | 537 g | 1,037 mg/kg |
| 5.0 kg/t | 0.50% | 1,343 g | 1,843 mg/kg |
*Calculated as 500 mg/kg initial phosphorus plus the theoretical elemental phosphorus contributed by the acid dose, on a 1,000 kg oil basis. It is an accounting example only.
Actual measured phosphorus depends on reaction, separation, adsorption, sampling, and method. Verify removal with outlet Phosphorus Content in Edible Oils.
Do not calculate an operating dose from 500 ppm alone. Dose depends on oil chemistry, process design, and separation. Follow a validated recipe or controlled trial, then verify the outlet (AOCS, Chemical Degumming).
Manual and PLC-based phosphorus dosing systems
Use an approved setpoint in kg acid per tonne of oil, and log Phosphorus Content in Edible Oils with the related batch data. Lab trends can inform recipe selection, but a phosphorus result must not directly drive the pump unless that control relationship has been validated.
| System | Operating approach | Benefits | Essential controls |
|---|---|---|---|
| Manual/operator-set | Operator selects a validated kg/t setpoint, adjusts the metering pump, and records acid use against oil throughput. | Simple and practical for batch or smaller lines. | Calibrated pump, written setpoint, independent flow or weight checks, batch records, and operator verification. |
| Automatic PLC ratio control | PLC calculates acid flow from measured oil throughput multiplied by the approved kg/t setpoint; a pump or control valve tracks the demand. | More consistent ratio as production rate changes; alarms and records can be automated. | Calibrated flowmeters, correct recipe selection, pump verification, alarm limits, and interlocks for low/no oil flow. |
| PLC with lab or FT-NIR feedback | A validated analytical result helps the operator or control strategy adjust the approved setpoint; the PLC still controls acid delivery against oil flow. | Supports trend-based correction and consistent documentation. | Reference-method checks, model validation, upper/lower setpoint limits, time-delay awareness, and a manual fallback. |
A simple ratio equation is:
Acid flow (kg/h) = oil throughput (tonnes/h) × approved acid dose (kg/tonne).
At 20 tonnes/hour, a validated setpoint of 1 kg/t equals 20 kg/hour of 85% acid. Setpoint selection is the process-engineering decision. Before commissioning, verify:
- Metering-pump calibration and actual delivered flow.
- Correct acid concentration and density data, where volumetric dosing is used.
- PLC recipe, oil-flow signal, engineering units, and scaling.
- Low/no-oil-flow interlocks, alarm limits, and a safe manual fallback.
- Batch records that connect the acid dose with the oil lot and lab results.
- Daily verification: Compare PLC totalizer totals with tank weight or another independent measurement, investigate discrepancies, and document manual interventions before the next batch is released.
Use Phosphorus Content in Edible Oils for PLC adjustment only after the relationship between the validated recipe and the process response has been demonstrated.
Sampling and laboratory quality control
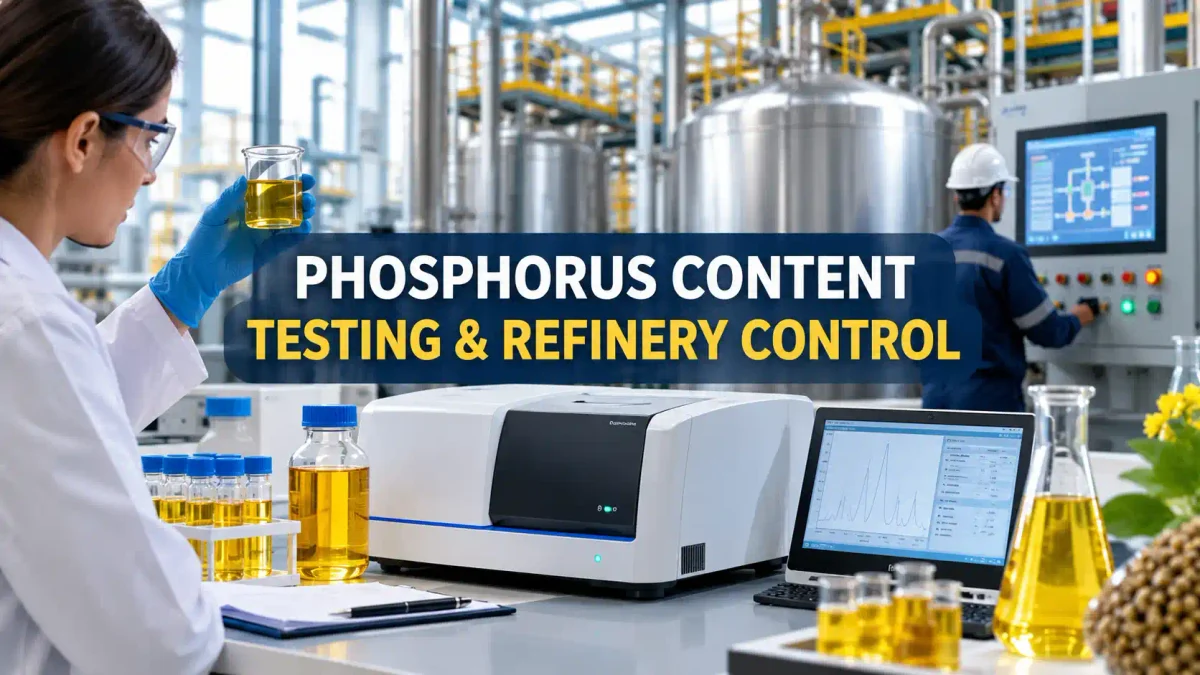
A trustworthy result starts with a representative sample. Gums and particles may not be evenly distributed in a tank or line, so poor sampling can look like poor process control. Follow the sampling SOP and record the sample point.
- Identify the oil, batch or tank, process stage, and sampling time.
- Follow the flushing and collection procedure for the defined sample point; do not collect from a stagnant line unless the procedure requires it.
- Use clean, dry containers that will not introduce water, phosphorus-containing residues, or cross-contamination.
- Homogenize and prepare the sample as the analytical method specifies, without adding moisture or losing suspended material unintentionally.
- Keep control samples, blanks, duplicates, and calibration checks at the frequency stated in the laboratory quality plan.
- Record the method, units, dilution, reporting limit, analyst, and any abnormal appearance such as haze or sediment.
When a result changes sharply, verify the sample and analytical controls before adjusting the recipe. Link the result to the relevant batch and process point.
Phosphorus testing: wet chemistry, ICP-OES, and FT-NIR
Choose the method for the oil matrix, expected range, turnaround time, and laboratory capability. For release decisions, use a validated reference method and define how borderline results will be handled.
Colorimetric method
ISO 10540-1 specifies a colorimetric method for phosphorus in animal and vegetable oils and fats. AOCS Ca 12-55 is another commonly referenced method.
The method-specific details must come from the controlled procedure. A routine workflow generally includes these checks:
- Homogenize and weigh a representative test portion as specified for the Phosphorus Content in Edible Oils method.
- Complete the required digestion or ashing preparation under the approved method.
- Prepare blanks, standards, and calibration controls.
- Develop and measure the coloured phosphorus complex using the specified conditions.
- Apply the prescribed calculation and report mg/kg, method, and any relevant dilution.
- Investigate failed blanks, poor control recovery, or duplicate disagreement before accepting the result.
Colorimetry can monitor Phosphorus Content in Edible Oils. Do not change sample mass, reagents, or preparation conditions without validation.
ICP-OES
ISO 10540-3 describes ICP-OES for low-phosphorus oil samples that are clear, without visible sediment or turbidity, and where phosphorus is in solution. Keep these limitations in mind:
- Fine particles, including bleaching earth, may not be represented correctly by the direct method.
- Turbid samples or samples outside the method’s scope need a suitable, validated preparation.
- Check recovery, calibration range, matrix effects, and reporting limit.
- Confirm unusual or borderline Phosphorus Content in Edible Oils results with the laboratory’s approved reference procedure.
Instrument sensitivity alone does not ensure accuracy. Validate the preparation and recovery before relying on Phosphorus Content in Edible Oils.
Can FT-NIR measure phosphorus?
FT-NIR can support rapid monitoring of Phosphorus Content in Edible Oils, but it usually does not measure elemental phosphorus directly like a phosphorus-specific wet-chemical or elemental method.
A calibrated model estimates the concentration from spectral patterns correlated with reference results. It is a prediction, not a direct measurement.
FT-NIR estimates Phosphorus Content in Edible Oils through a calibration model, so treat the output as a prediction. Calibration should include:
- Representative samples for Phosphorus Content in Edible Oils across the oil types and process stages where the model will be used.
- Reference-method results covering the expected concentration range, especially the low levels relevant before physical refining.
- Independent validation samples that were not used to fit the model.
- Checks of bias, prediction error, repeatability, and performance near the release limit.
- Periodic comparison of predicted Phosphorus Content in Edible Oils with the reference method, and revalidation when feedstocks, instruments, or process conditions change.
Unless performance is acceptable at the target level, use FT-NIR for screening and trends rather than as the sole release test.
Research has also explored NIR monitoring of enzymatic degumming by predicting diglycerides (PubMed study); this does not mean every FT-NIR instrument directly measures elemental phosphorus.
Phosphorus through each refinery stage and the final specification
Test at defined points and compare like with like. Compare Phosphorus Content in Edible Oils results at each stage to locate process changes.
| Process stage | What to check | Practical target or specification note |
|---|---|---|
| Crude oil | Incoming phosphorus load and trend by oil type/batch | No universal crude-oil limit for degumming calculations; use feed data to choose the validated process recipe. |
| After degumming | Efficiency of gum separation and readiness for downstream refining | AOCS references below 10 mg/kg as general guidance; a 3 mg/kg pre-bleaching target is discussed for physical refining. Confirm plant requirements. |
| After bleaching | Residual phosphorus, filter performance, and possible adsorbent/particle carryover | Should meet the plant’s validated pre-deodorization limit; bleaching is not a substitute for correcting inadequate degumming. |
| Final deodorization | Finished-oil result and trend, preferably with a fit-for-purpose method | Codex CXS 210-1999 does not state a single universal maximum phosphorus level for all named vegetable oils. Apply the relevant national, customer, and product specification. |
The Codex Standard for Named Vegetable Oils, CXS 210-1999 covers named-oil identity and quality, but has no single final-phosphorus limit for all edible oils. Keep Phosphorus Content in Edible Oils specifications and process targets distinct:
- Regulatory limit: a requirement stated in an applicable law or product standard.
- Customer specification: the limit agreed for a particular product or market.
- Plant process target: an internal Phosphorus Content in Edible Oils control point that may be stricter than the release specification.
Do not label an internal target such as 1, 3, or 5 mg/kg as a Codex limit unless the applicable standard explicitly says so.
Troubleshooting a high or inconsistent result
When Phosphorus Content in Edible Oils rises unexpectedly, verify the result before changing the dose. Check these points first:
- Check the sample: confirm the sampling point, flushing procedure, container cleanliness, and batch identity. Mix and prepare the laboratory sample as required by the method.
- Check the analysis: review blanks, calibration, duplicates, control samples, reporting limit, and method suitability. If FT-NIR is used, compare it with the reference method.
- Review the feed: compare incoming oil data and the recent history of seed source, extraction, or storage.
- Verify dosing: check acid concentration, pump calibration, selected recipe, flowmeter scaling, and the actual delivered dose; then compare outlet Phosphorus Content in Edible Oils with baseline.
- Review contact and separation: confirm mixing, contact time, specified water addition, centrifuge settings, flow rate, interface control, and discharge operation.
- Check downstream stages: review bleaching-earth condition, filtration, particle carryover, and possible treatment-derived phosphorus.
- Document follow-up: record the likely cause, corrective action, responsible person, and result of the next sample.
More acid is not always the answer. It can raise costs or create downstream problems. Trend results alongside oil loss, chemical use, colour, soap, moisture, and filtration performance.
Conclusion
Phosphorus Content in Edible Oils testing should support a process decision. Measure crude oil, verify degumming, and test the required later stages. Use the 85% acid calculation for mass balance, not to guess dosage.
Combine a validated reference method, calibrated FT-NIR where suitable, representative sampling, and controlled dosing to meet quality requirements with minimal avoidable loss.
References
- AOCS, Oil Refining.
- AOCS, Chemical Degumming.
- ISO, ISO 10540-1 — Phosphorus by colorimetric method.
- ISO, ISO 10540-3 — Phosphorus by ICP-OES.
- FAO/WHO Codex Alimentarius, Standard for Named Vegetable Oils, CXS 210-1999.
- United States Patent US9045712B2, Oil degumming methods.
- PubMed, NIR monitoring of enzymatic degumming.
Frequently asked questions
What is a normal phosphorus level in degummed oil?
It depends on the oil and route. AOCS references below 10 mg/kg after degumming and discusses 3 mg/kg before bleaching for physical refining. Treat these as technical guidance, not universal legal limits.
Can I calculate phosphoric-acid dosage directly from 500 ppm phosphorus?
No. The result gives total elemental phosphorus, not the full phospholipid profile or calcium and magnesium burden. Set the dose using a validated plant curve or controlled trials, then check the outlet result.
Does FT-NIR replace the reference phosphorus test?
Not automatically. FT-NIR can predict phosphorus only when a suitable calibration has been validated against a reference method over the required concentration range. Low-level release decisions need particular care.
Is phosphorus the same as phospholipid content?
No. Phosphorus is an element present in many phospholipids, but total phosphorus does not identify each compound or establish a universal conversion to total phospholipid mass.
Does Codex set a maximum phosphorus limit for all refined vegetable oils?
CXS 210-1999 does not set one universal final-phosphorus maximum for all named oils. Check national rules, product standards, customer agreements, and the plant specification.


Leave a Comment